The Economist US election forecast
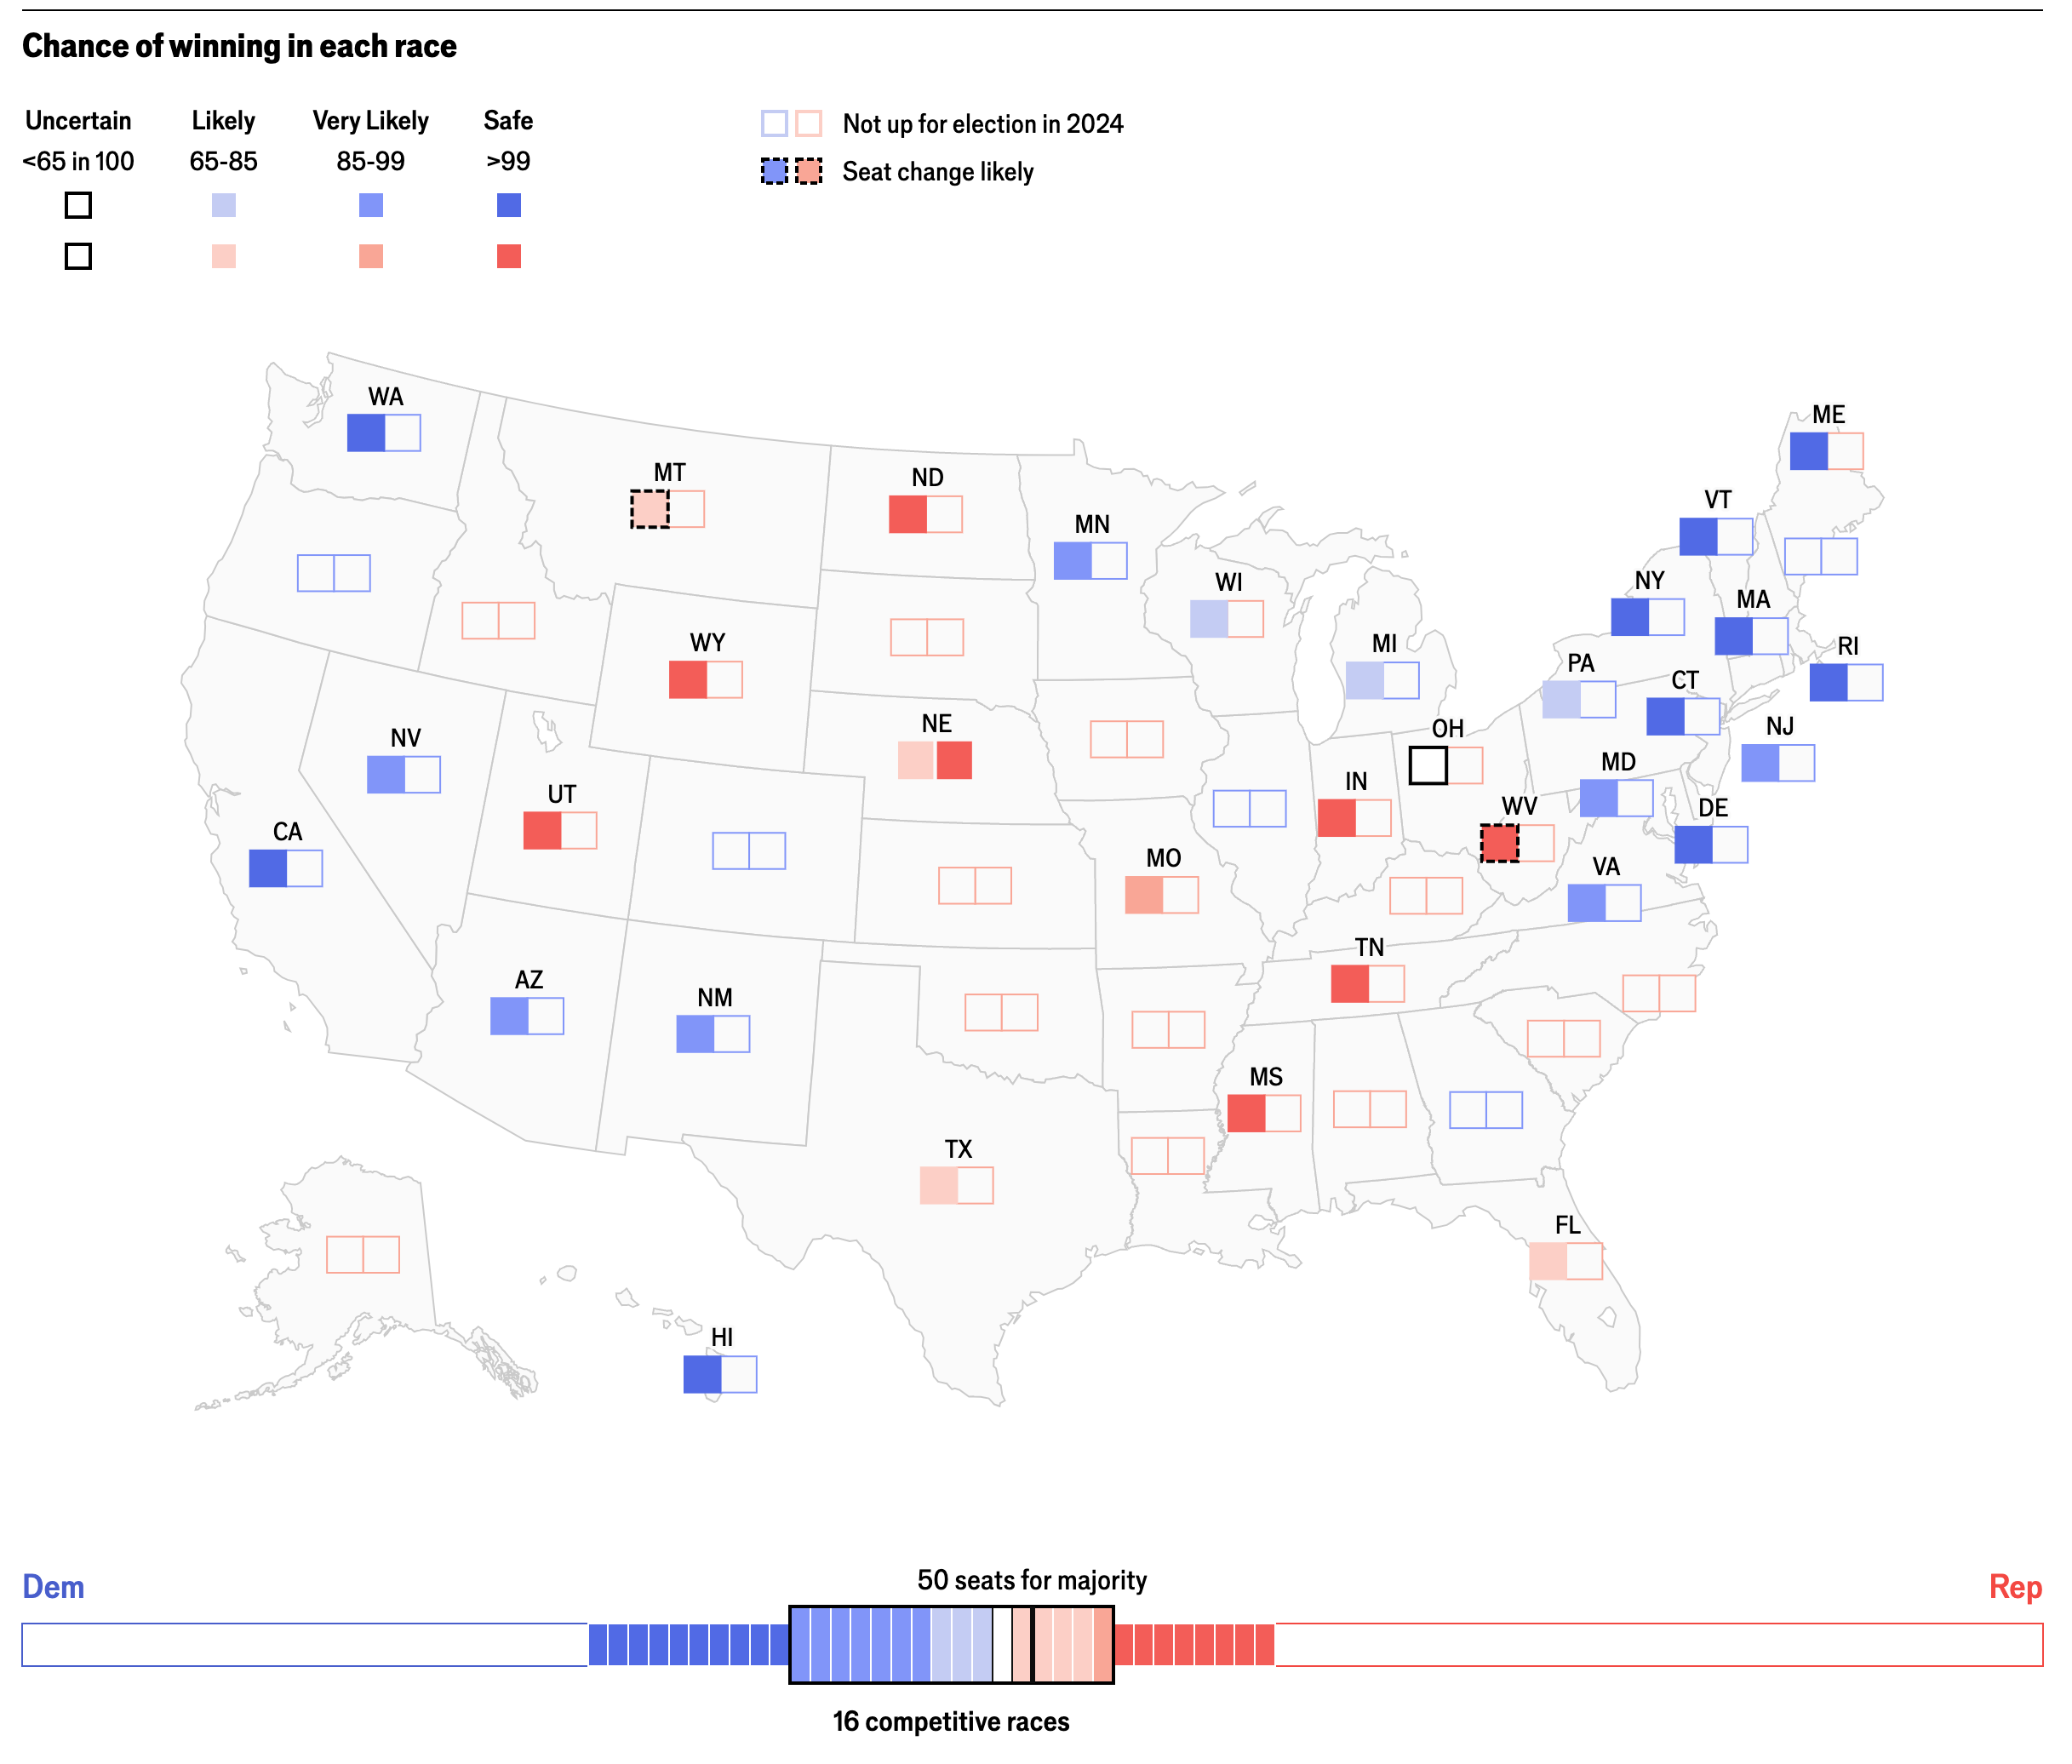
This project represents the final results of our work to design and build the interactive visualisations for the Economist’s 2024 US election forecast. This prediction model includes visualisations for the Presidential race as well as the House and Senate.
My part began by building out wireframes based on the 2016 election and 2020 midterms which served as the initial framework. We discussed what worked from those interactives and what needed to change and iterated on those in the design. It was important to find the right balance between clear topline information while giving the appropriate context in detail.
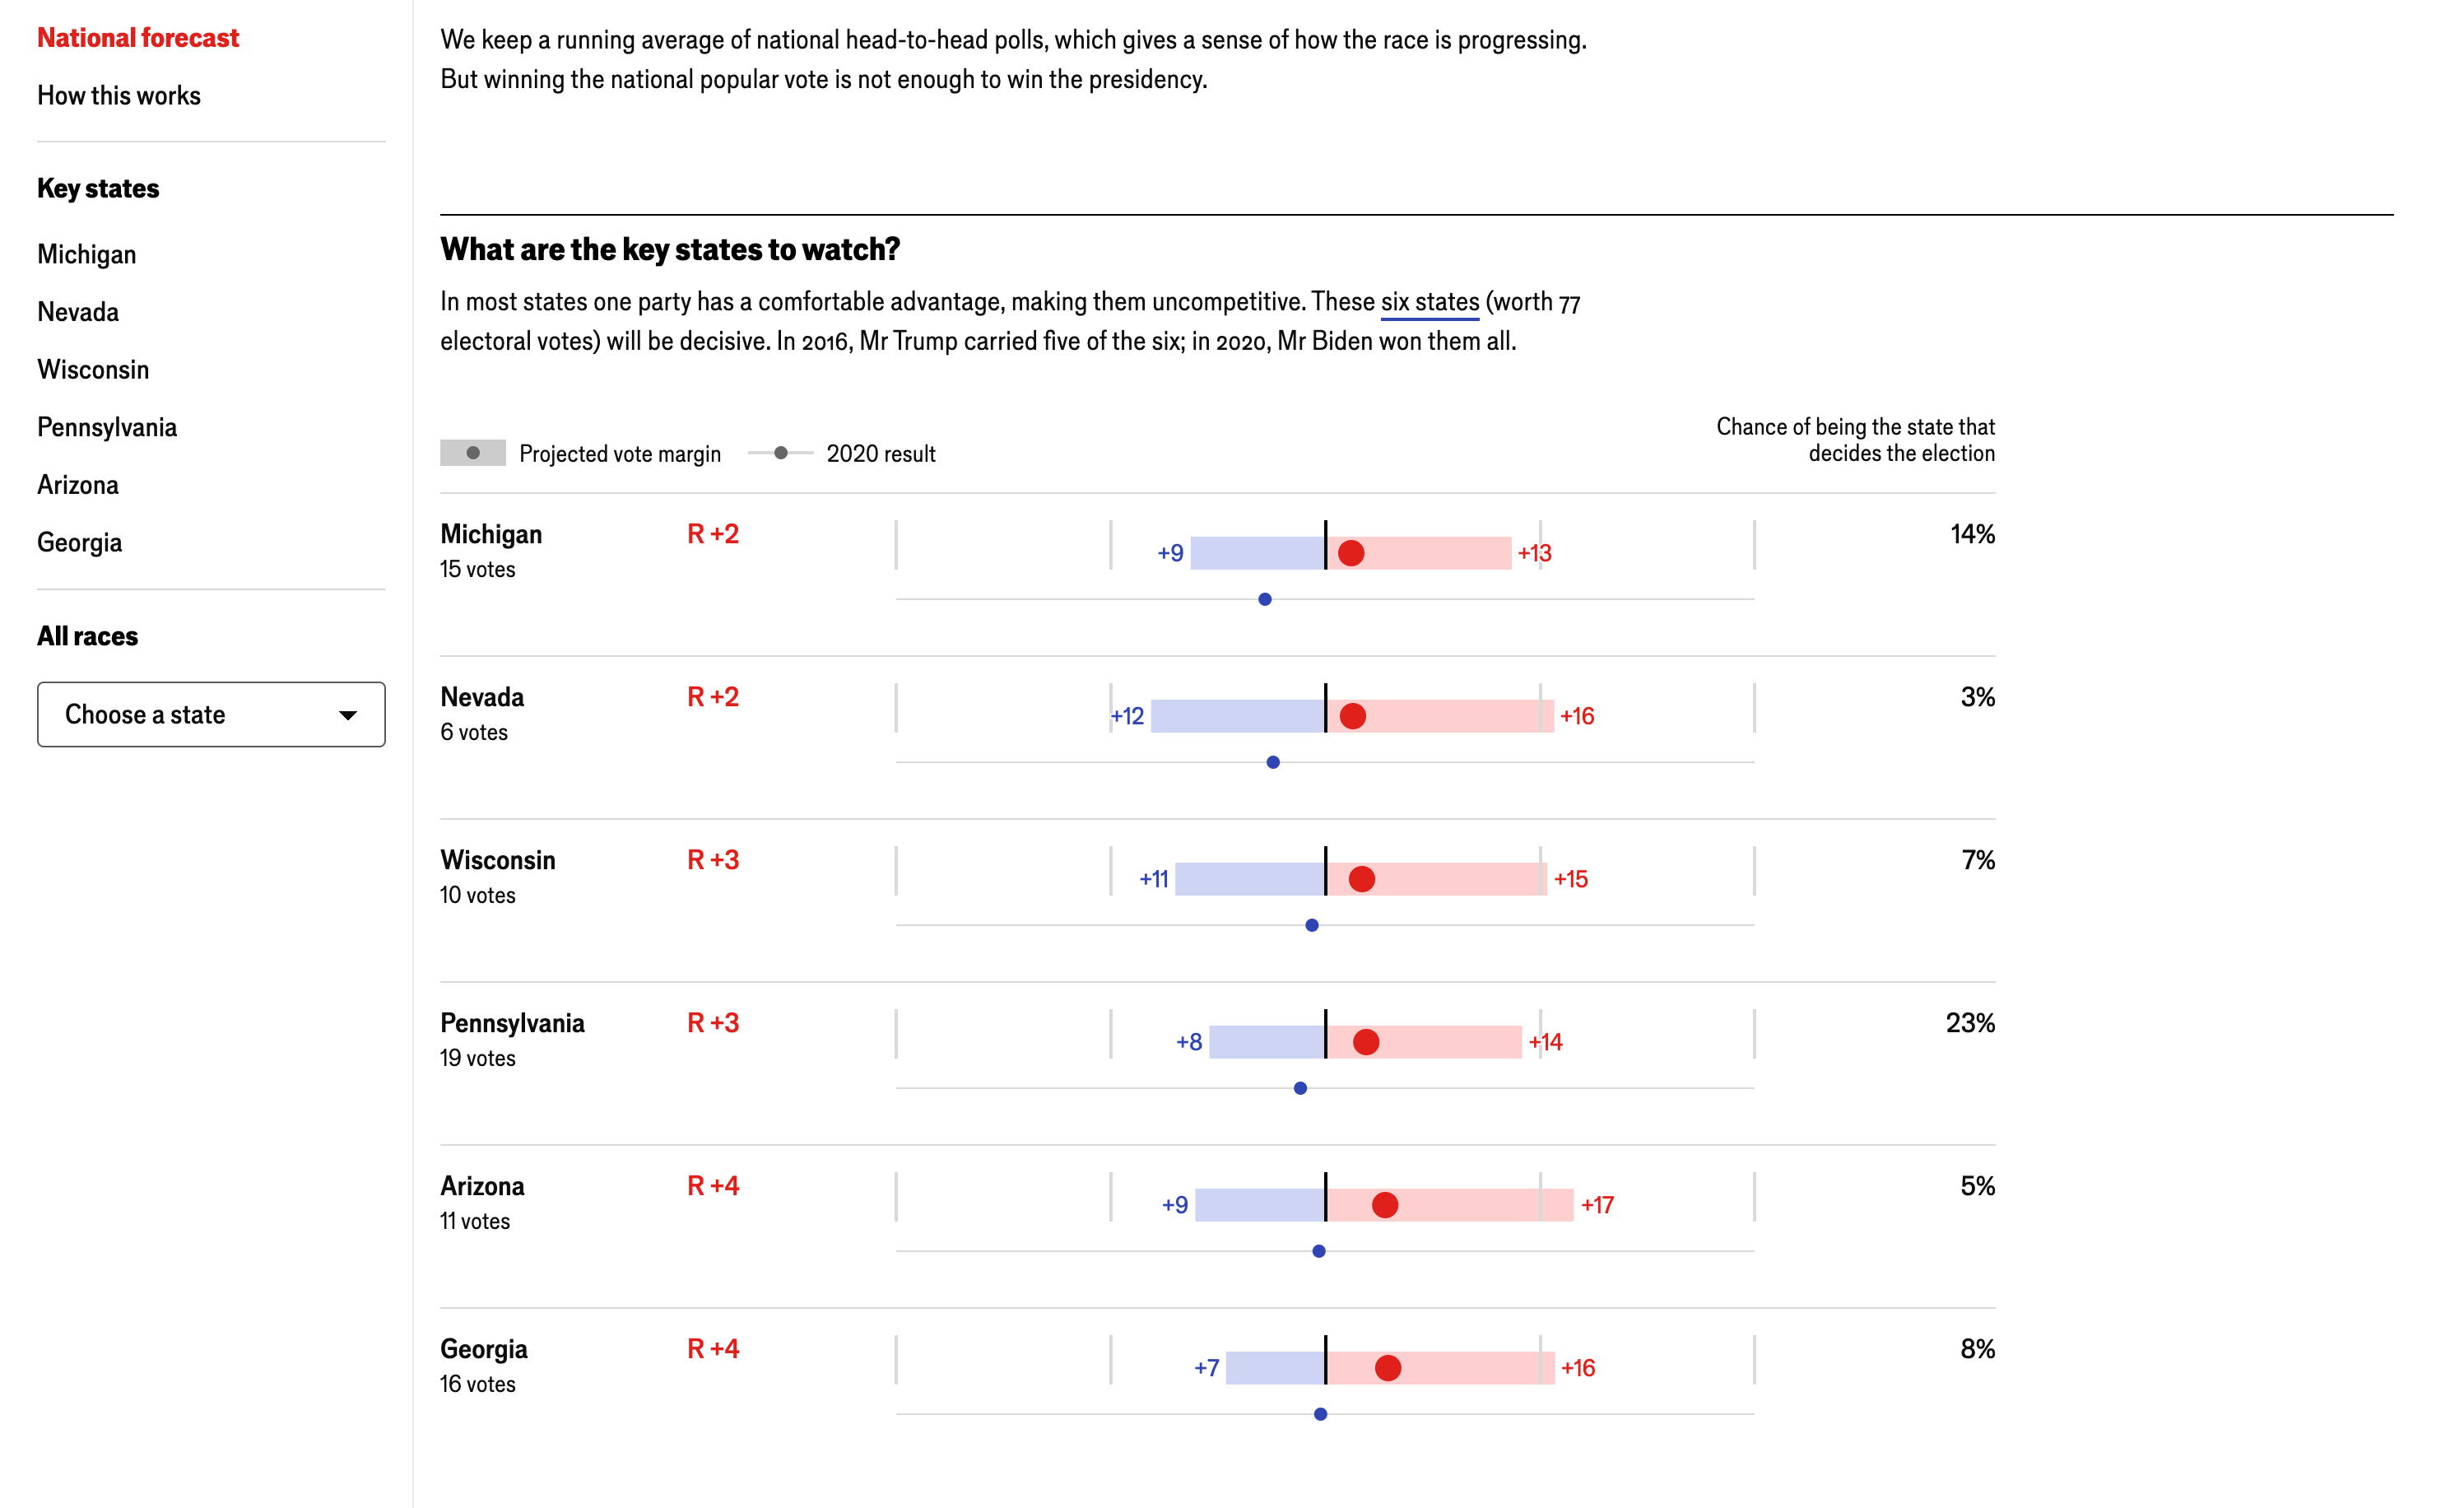
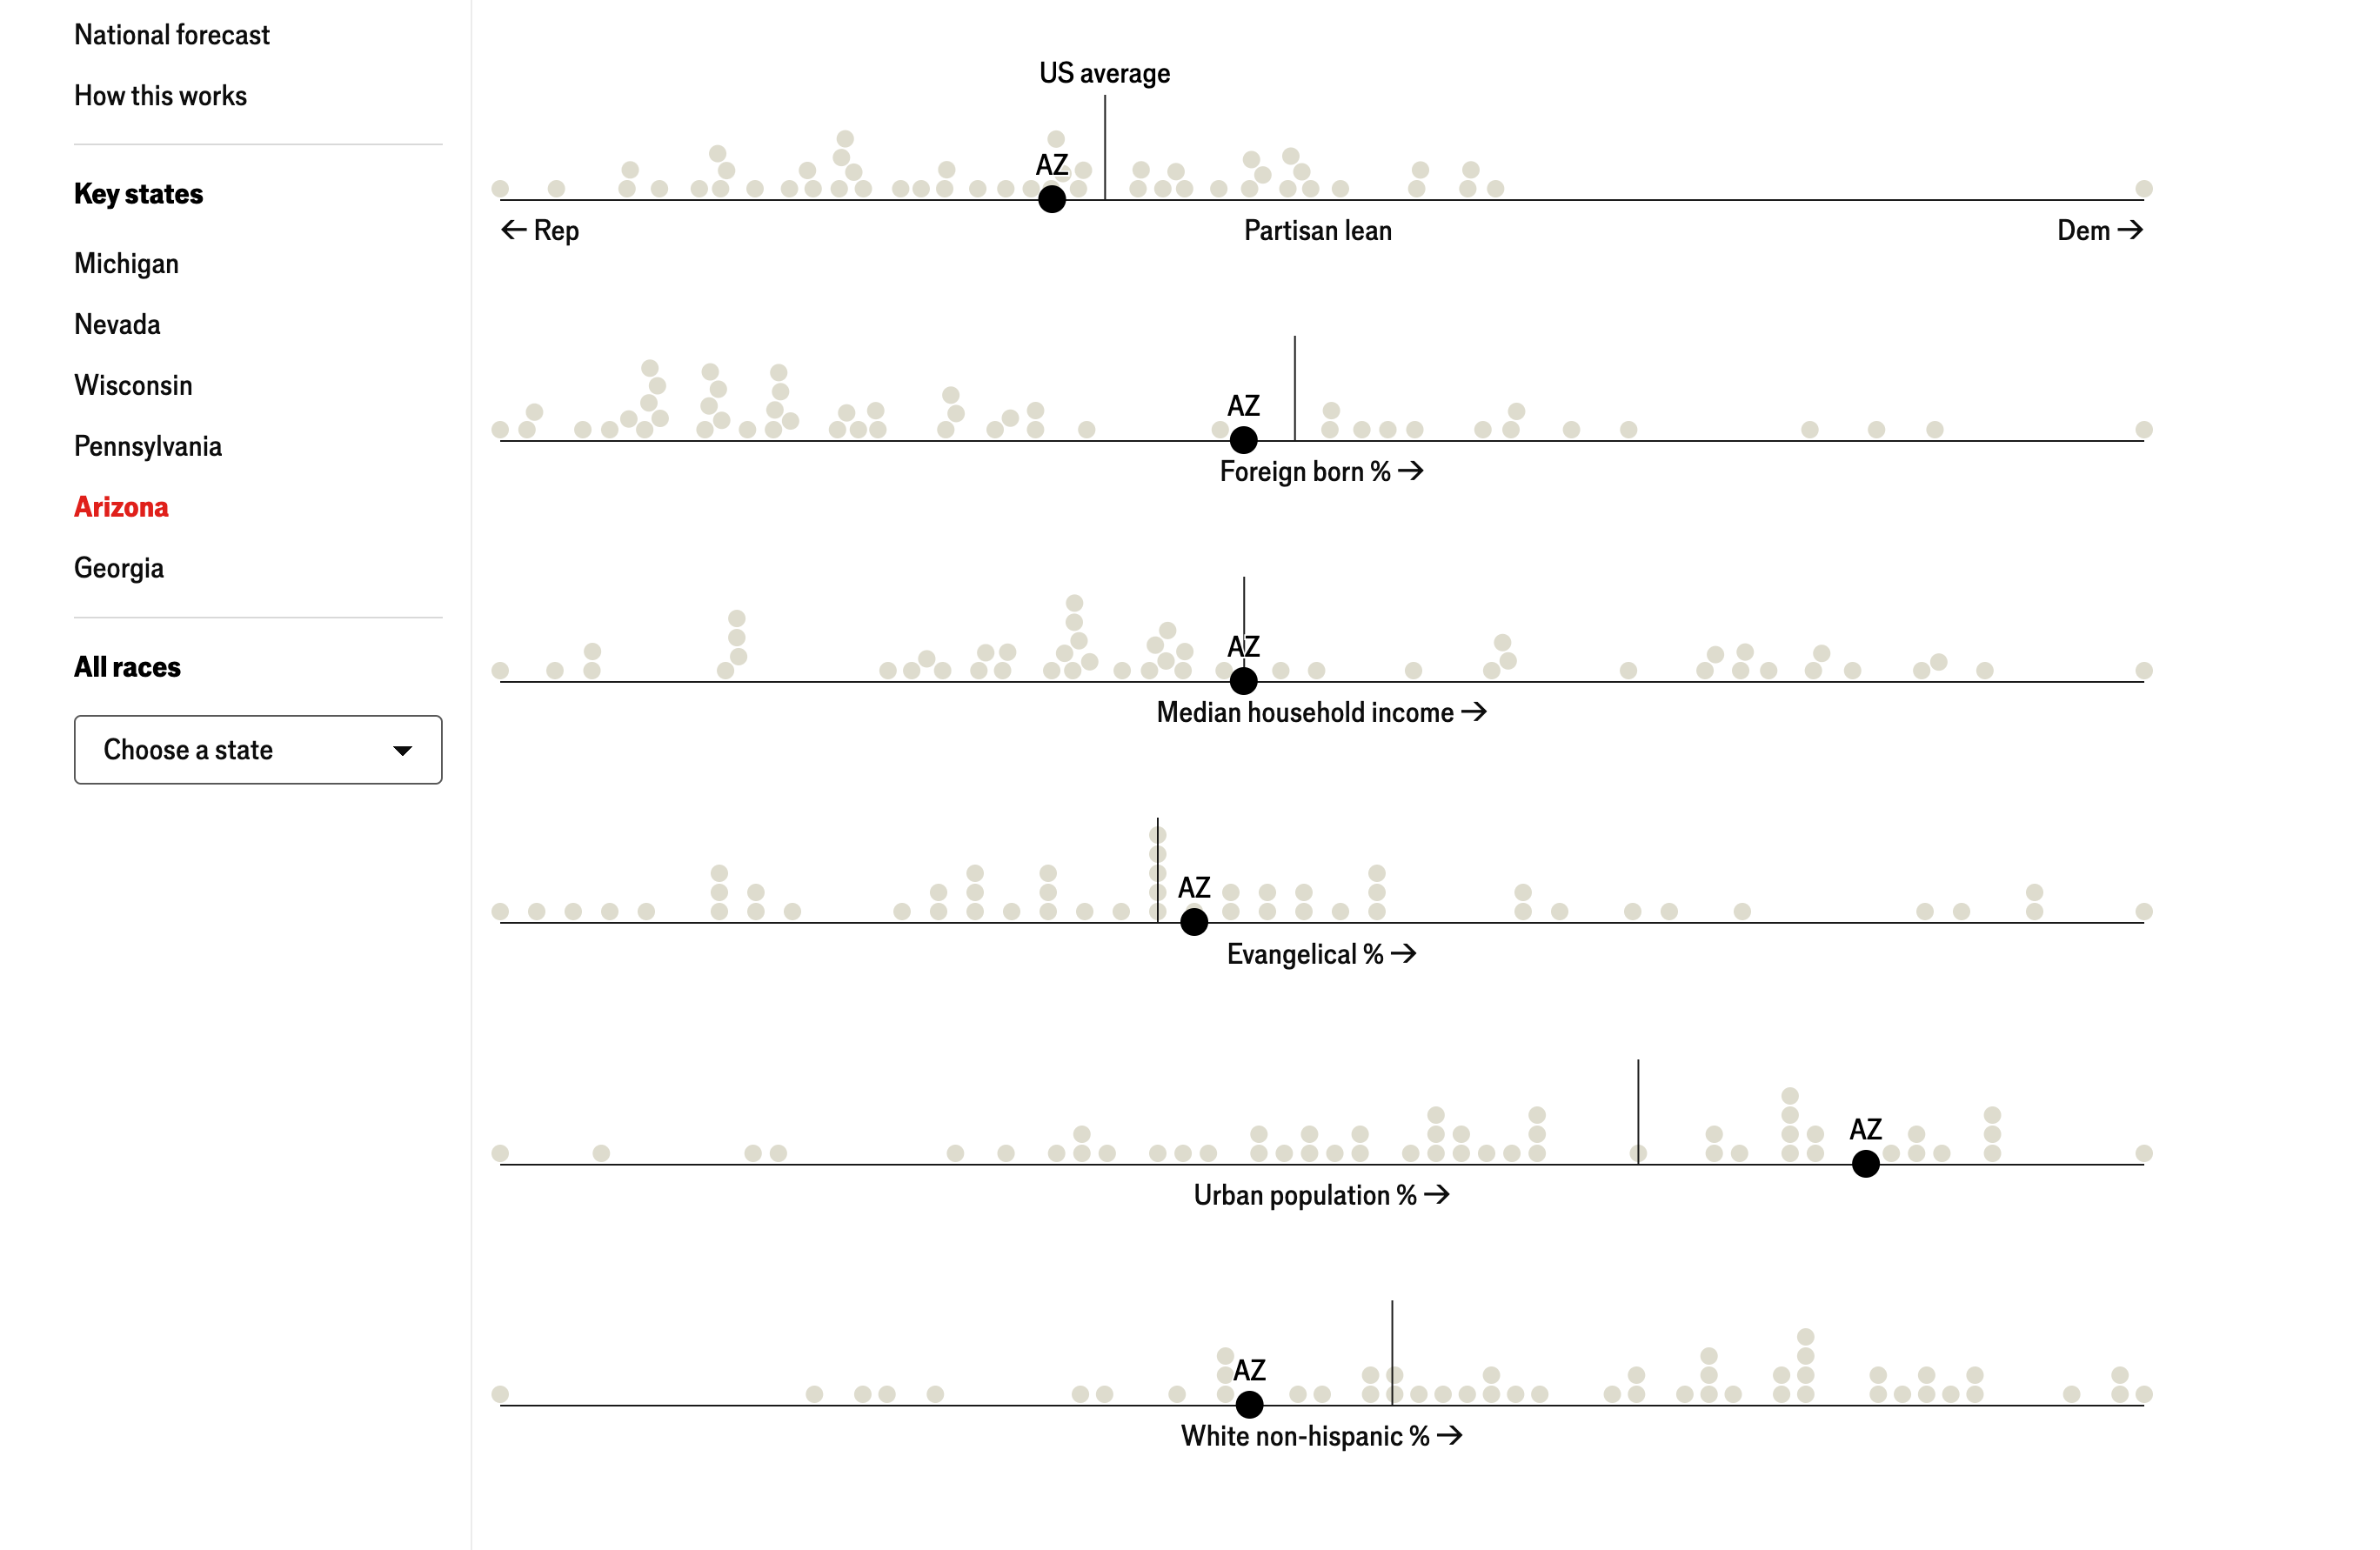
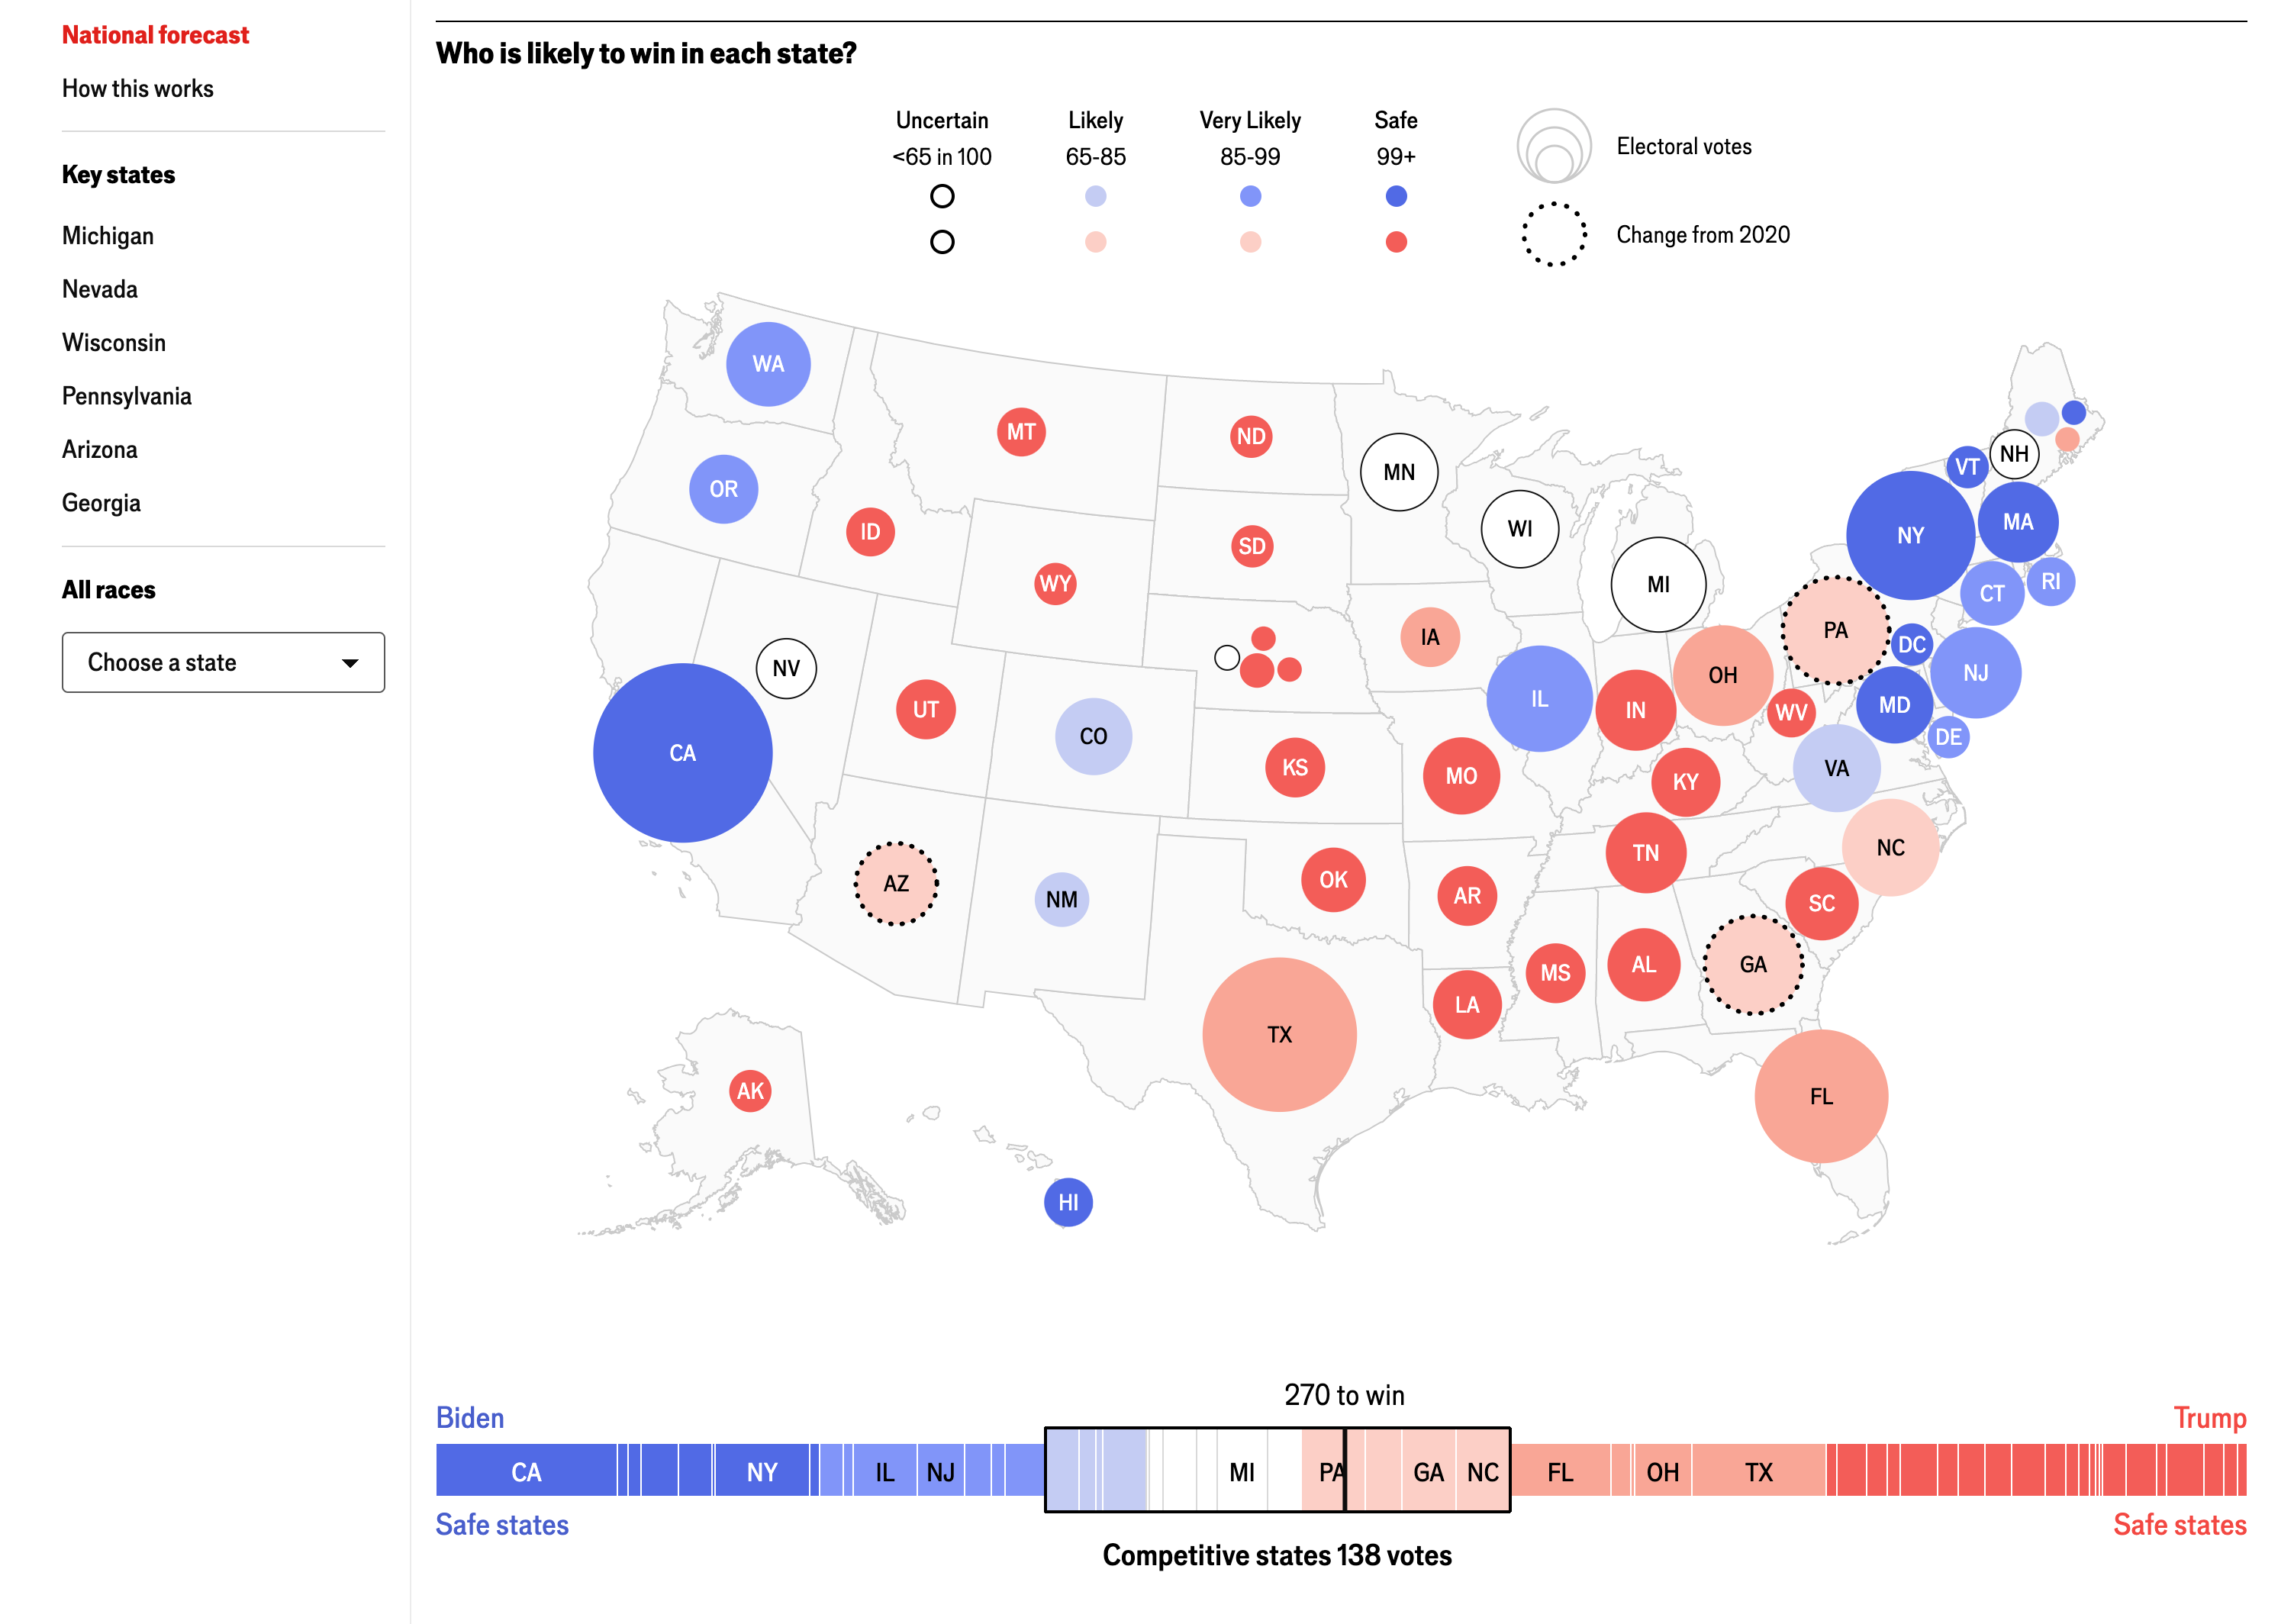
We wanted the demographics of each state to play a role so I prototyped a simple beeswarm chart that was used in the final model. I also built the ‘key states to watch’ section and the main state map. The map was a tricky challenge as there were more conditions and varying states than I first thought. Especially with Maine and Nebraska which has a different electoral college system than the other states so needed to be represented slightly differently. Overall I was happy to work on this element as it was great practice for building a robust component that can manage data that is consistently changing.