The Economist's US election results 2024
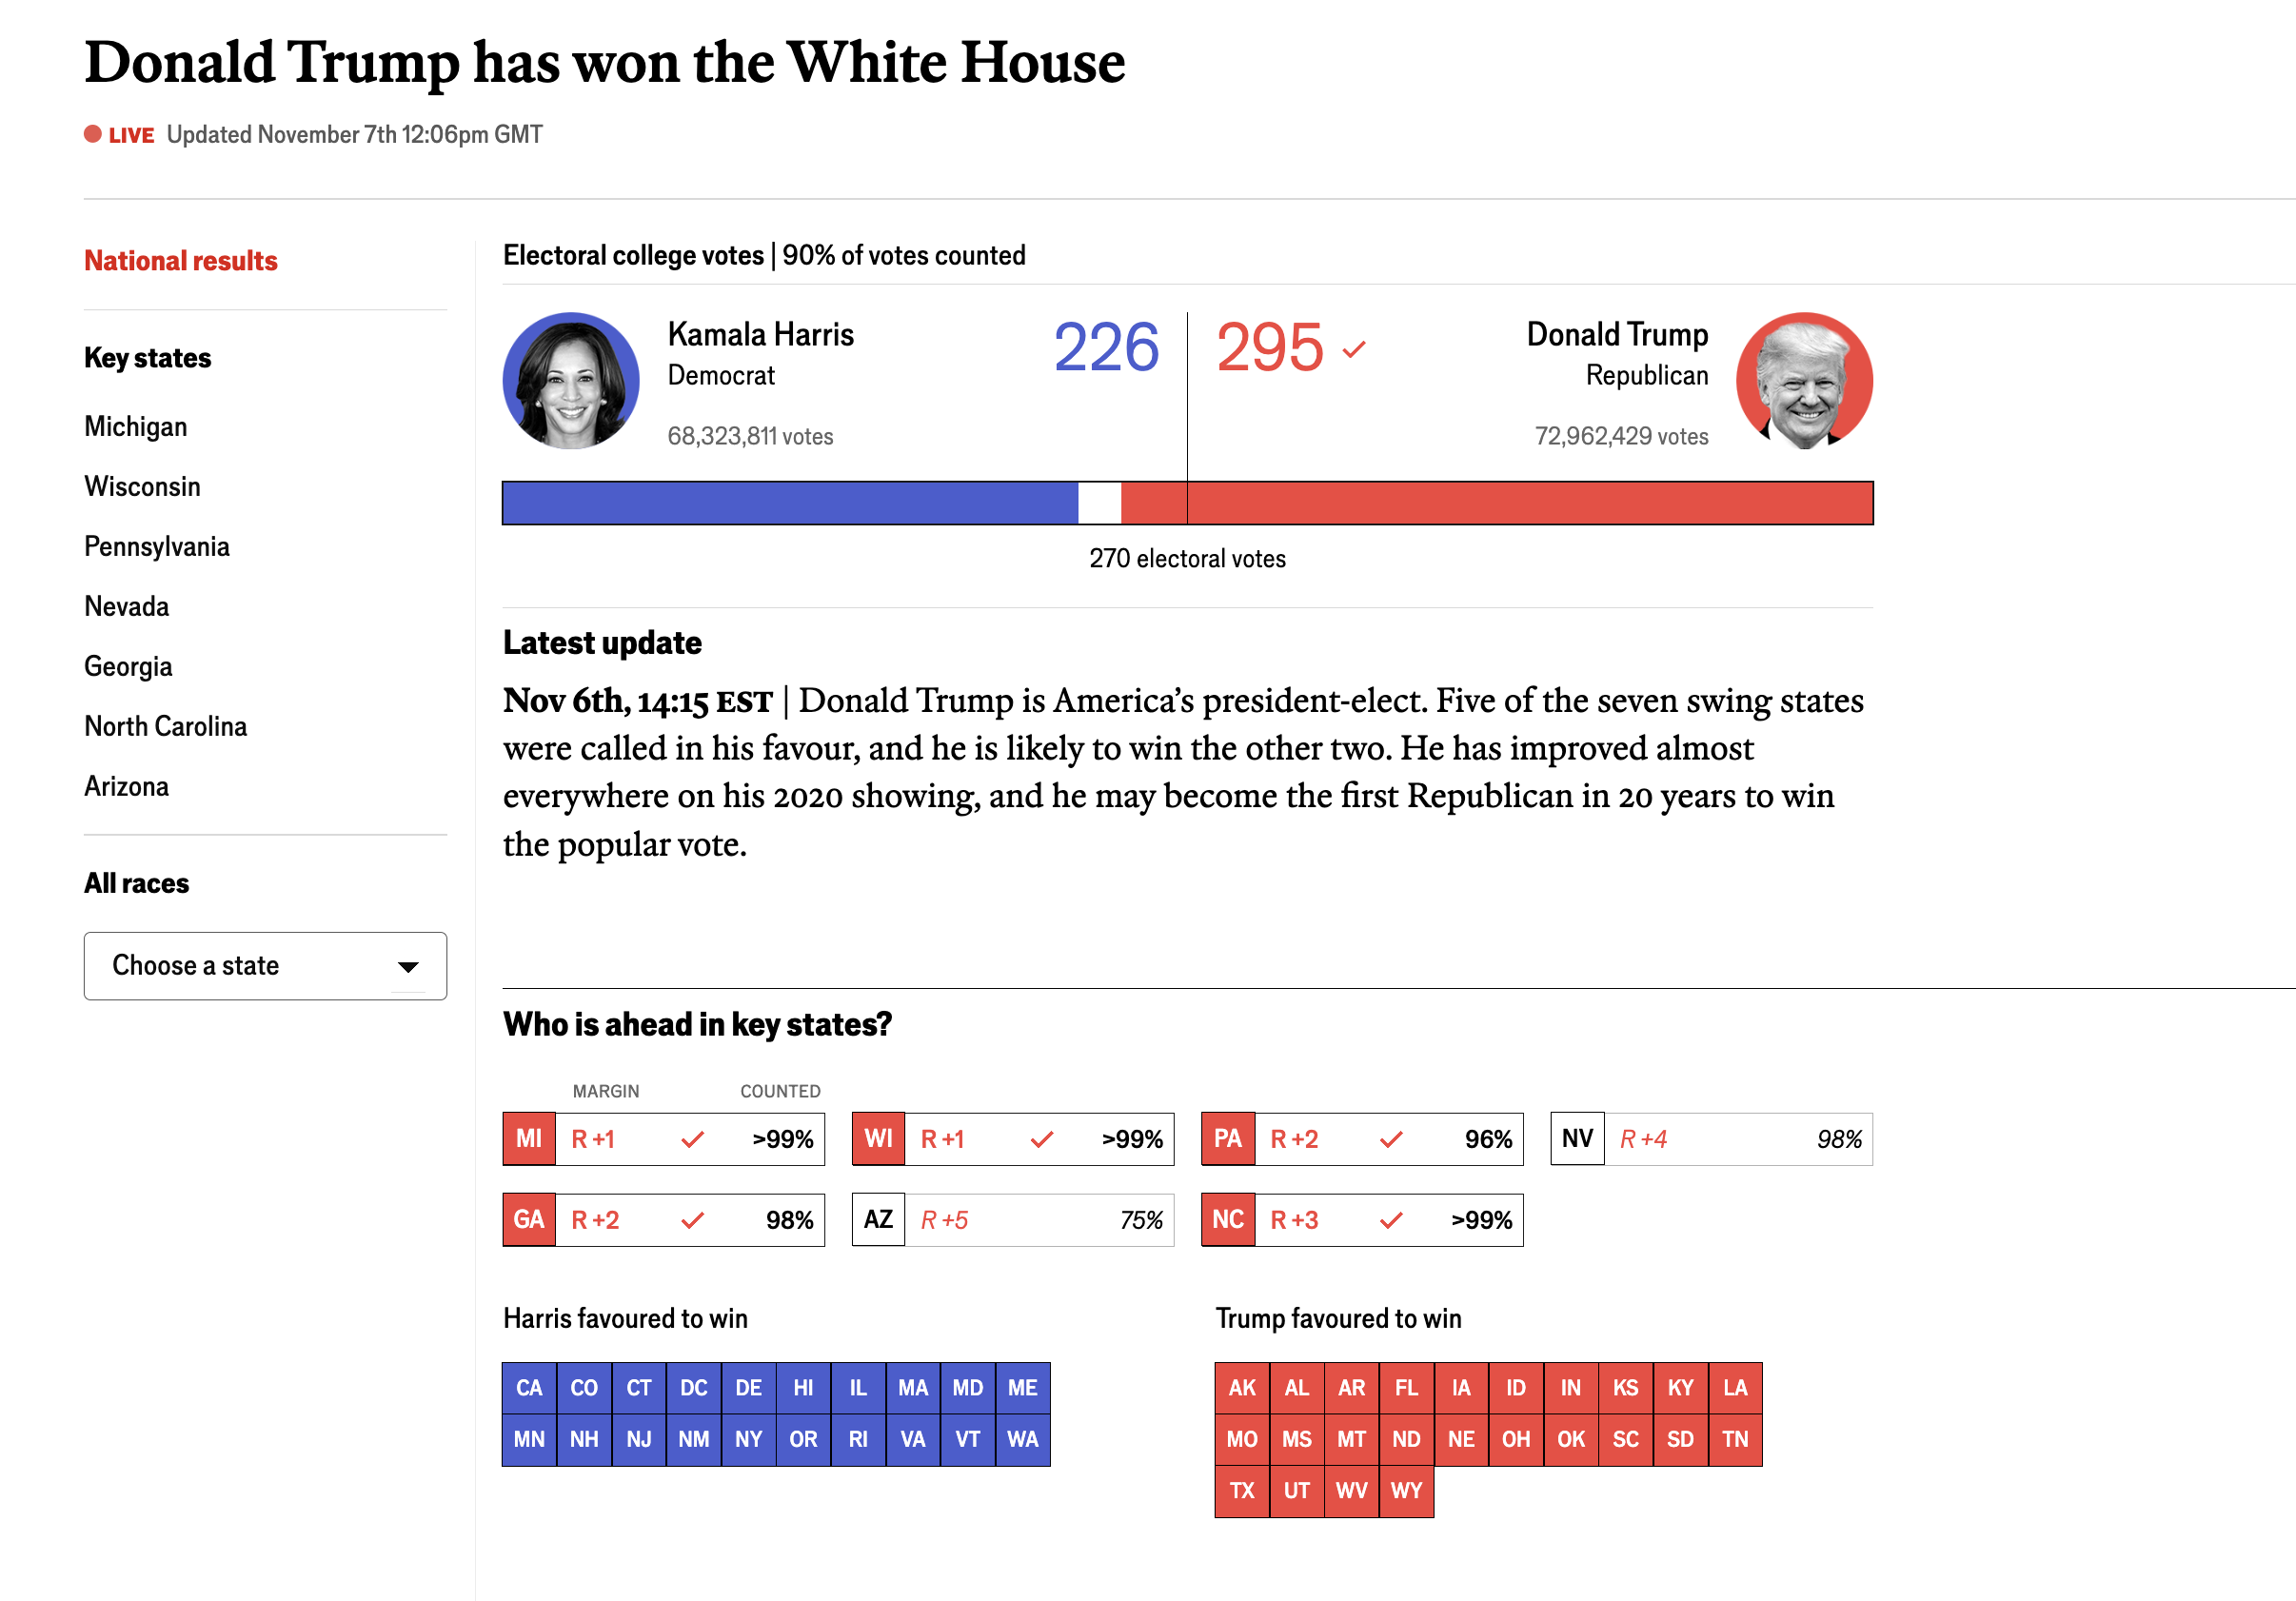
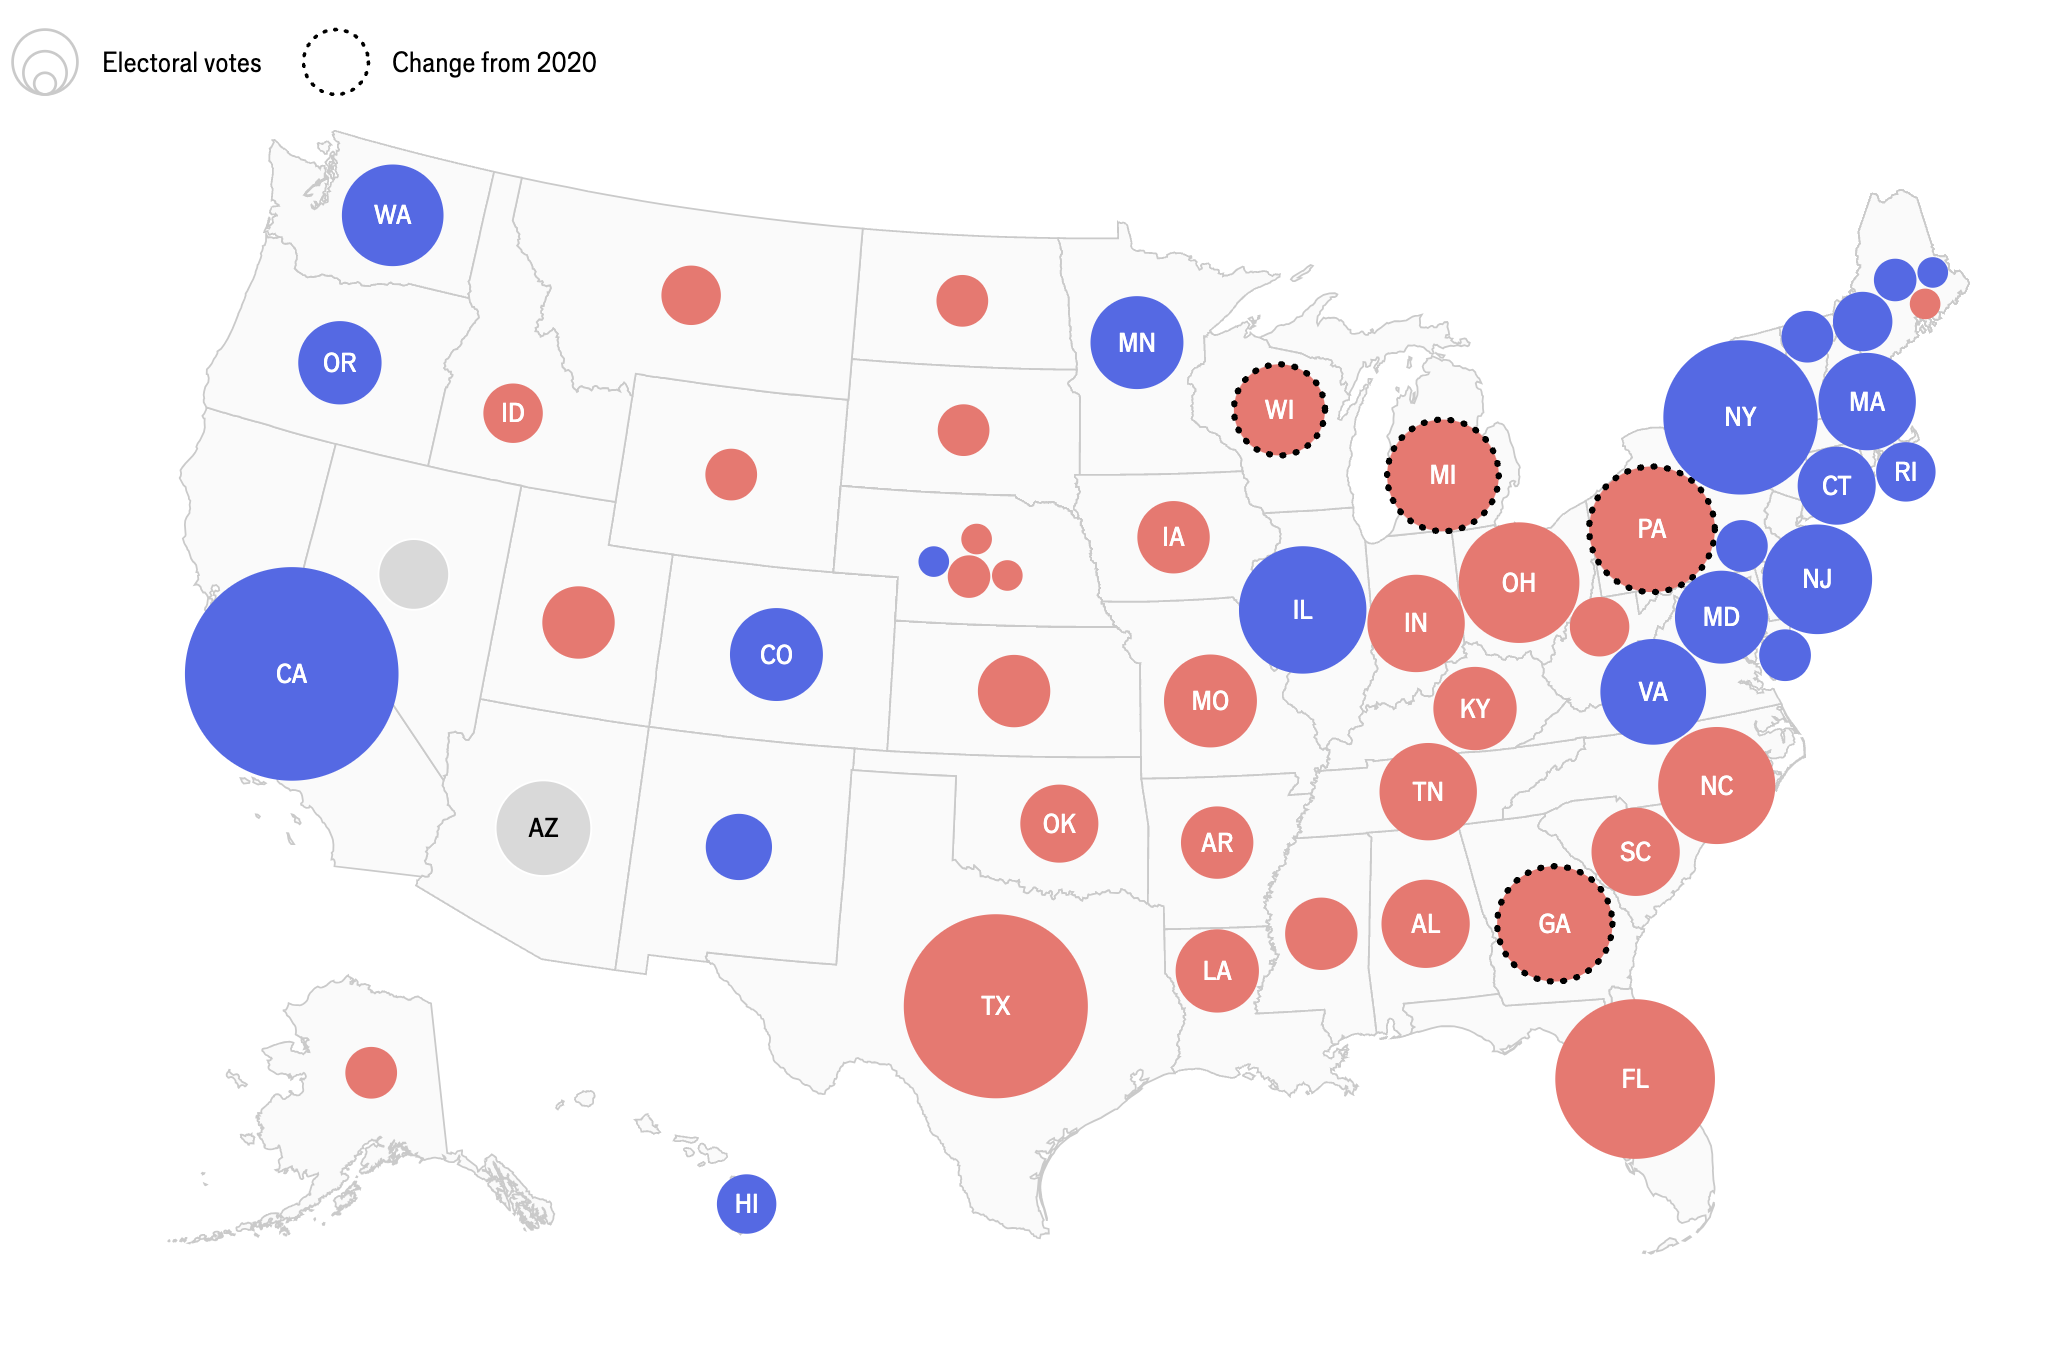
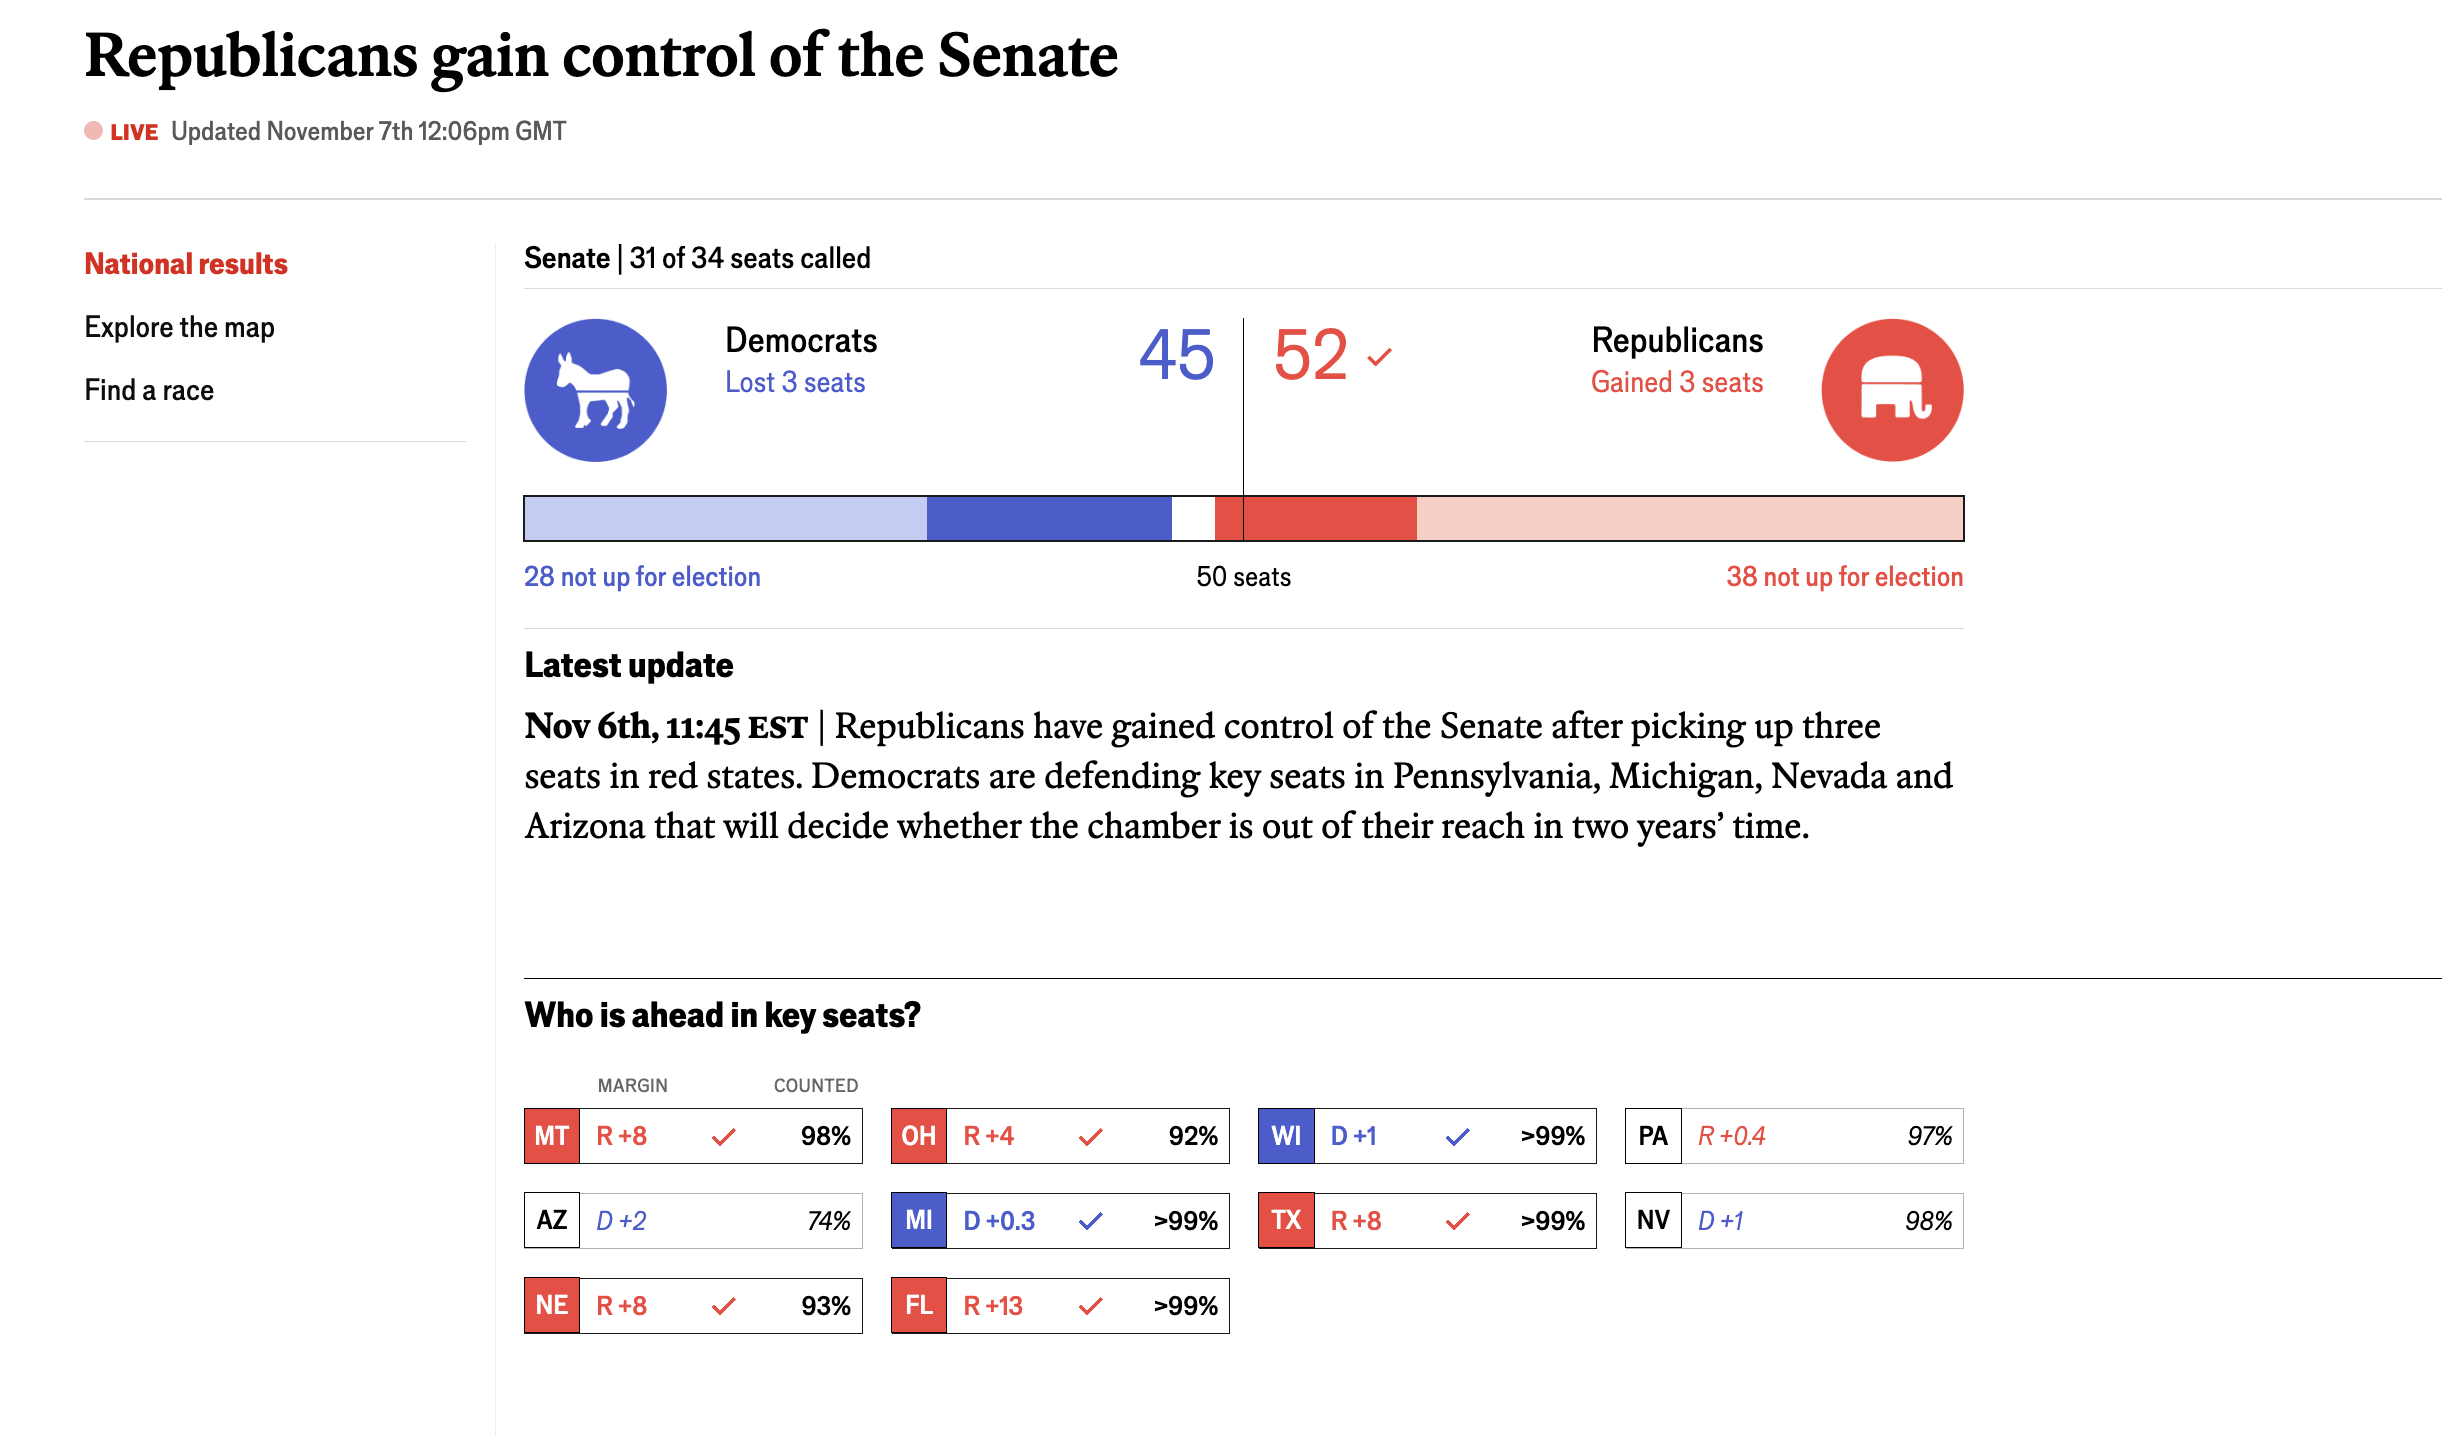
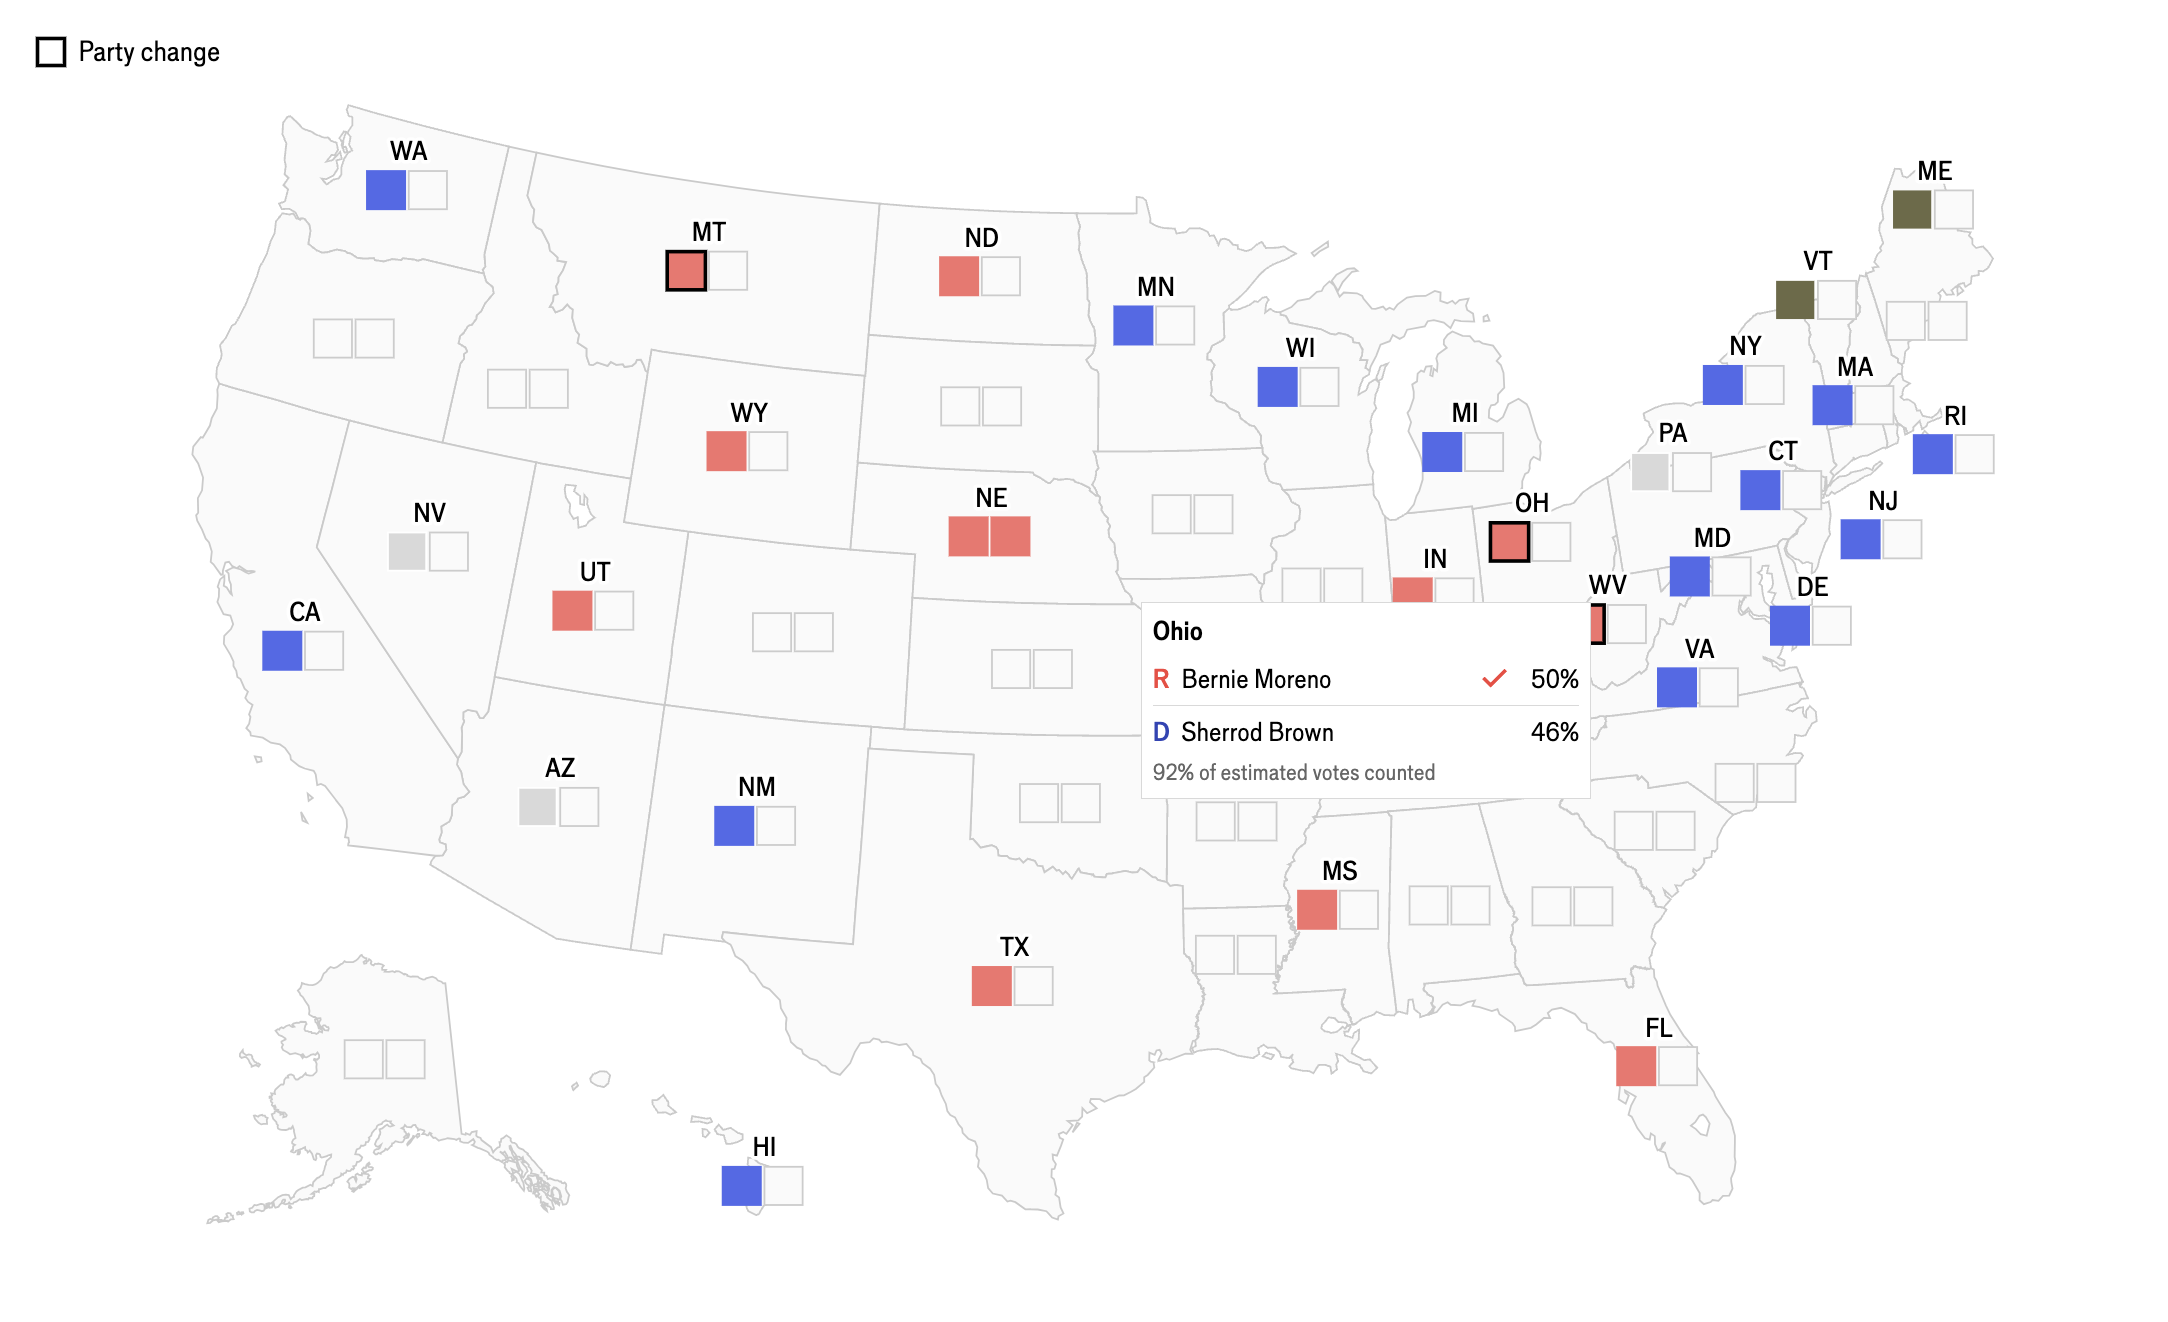
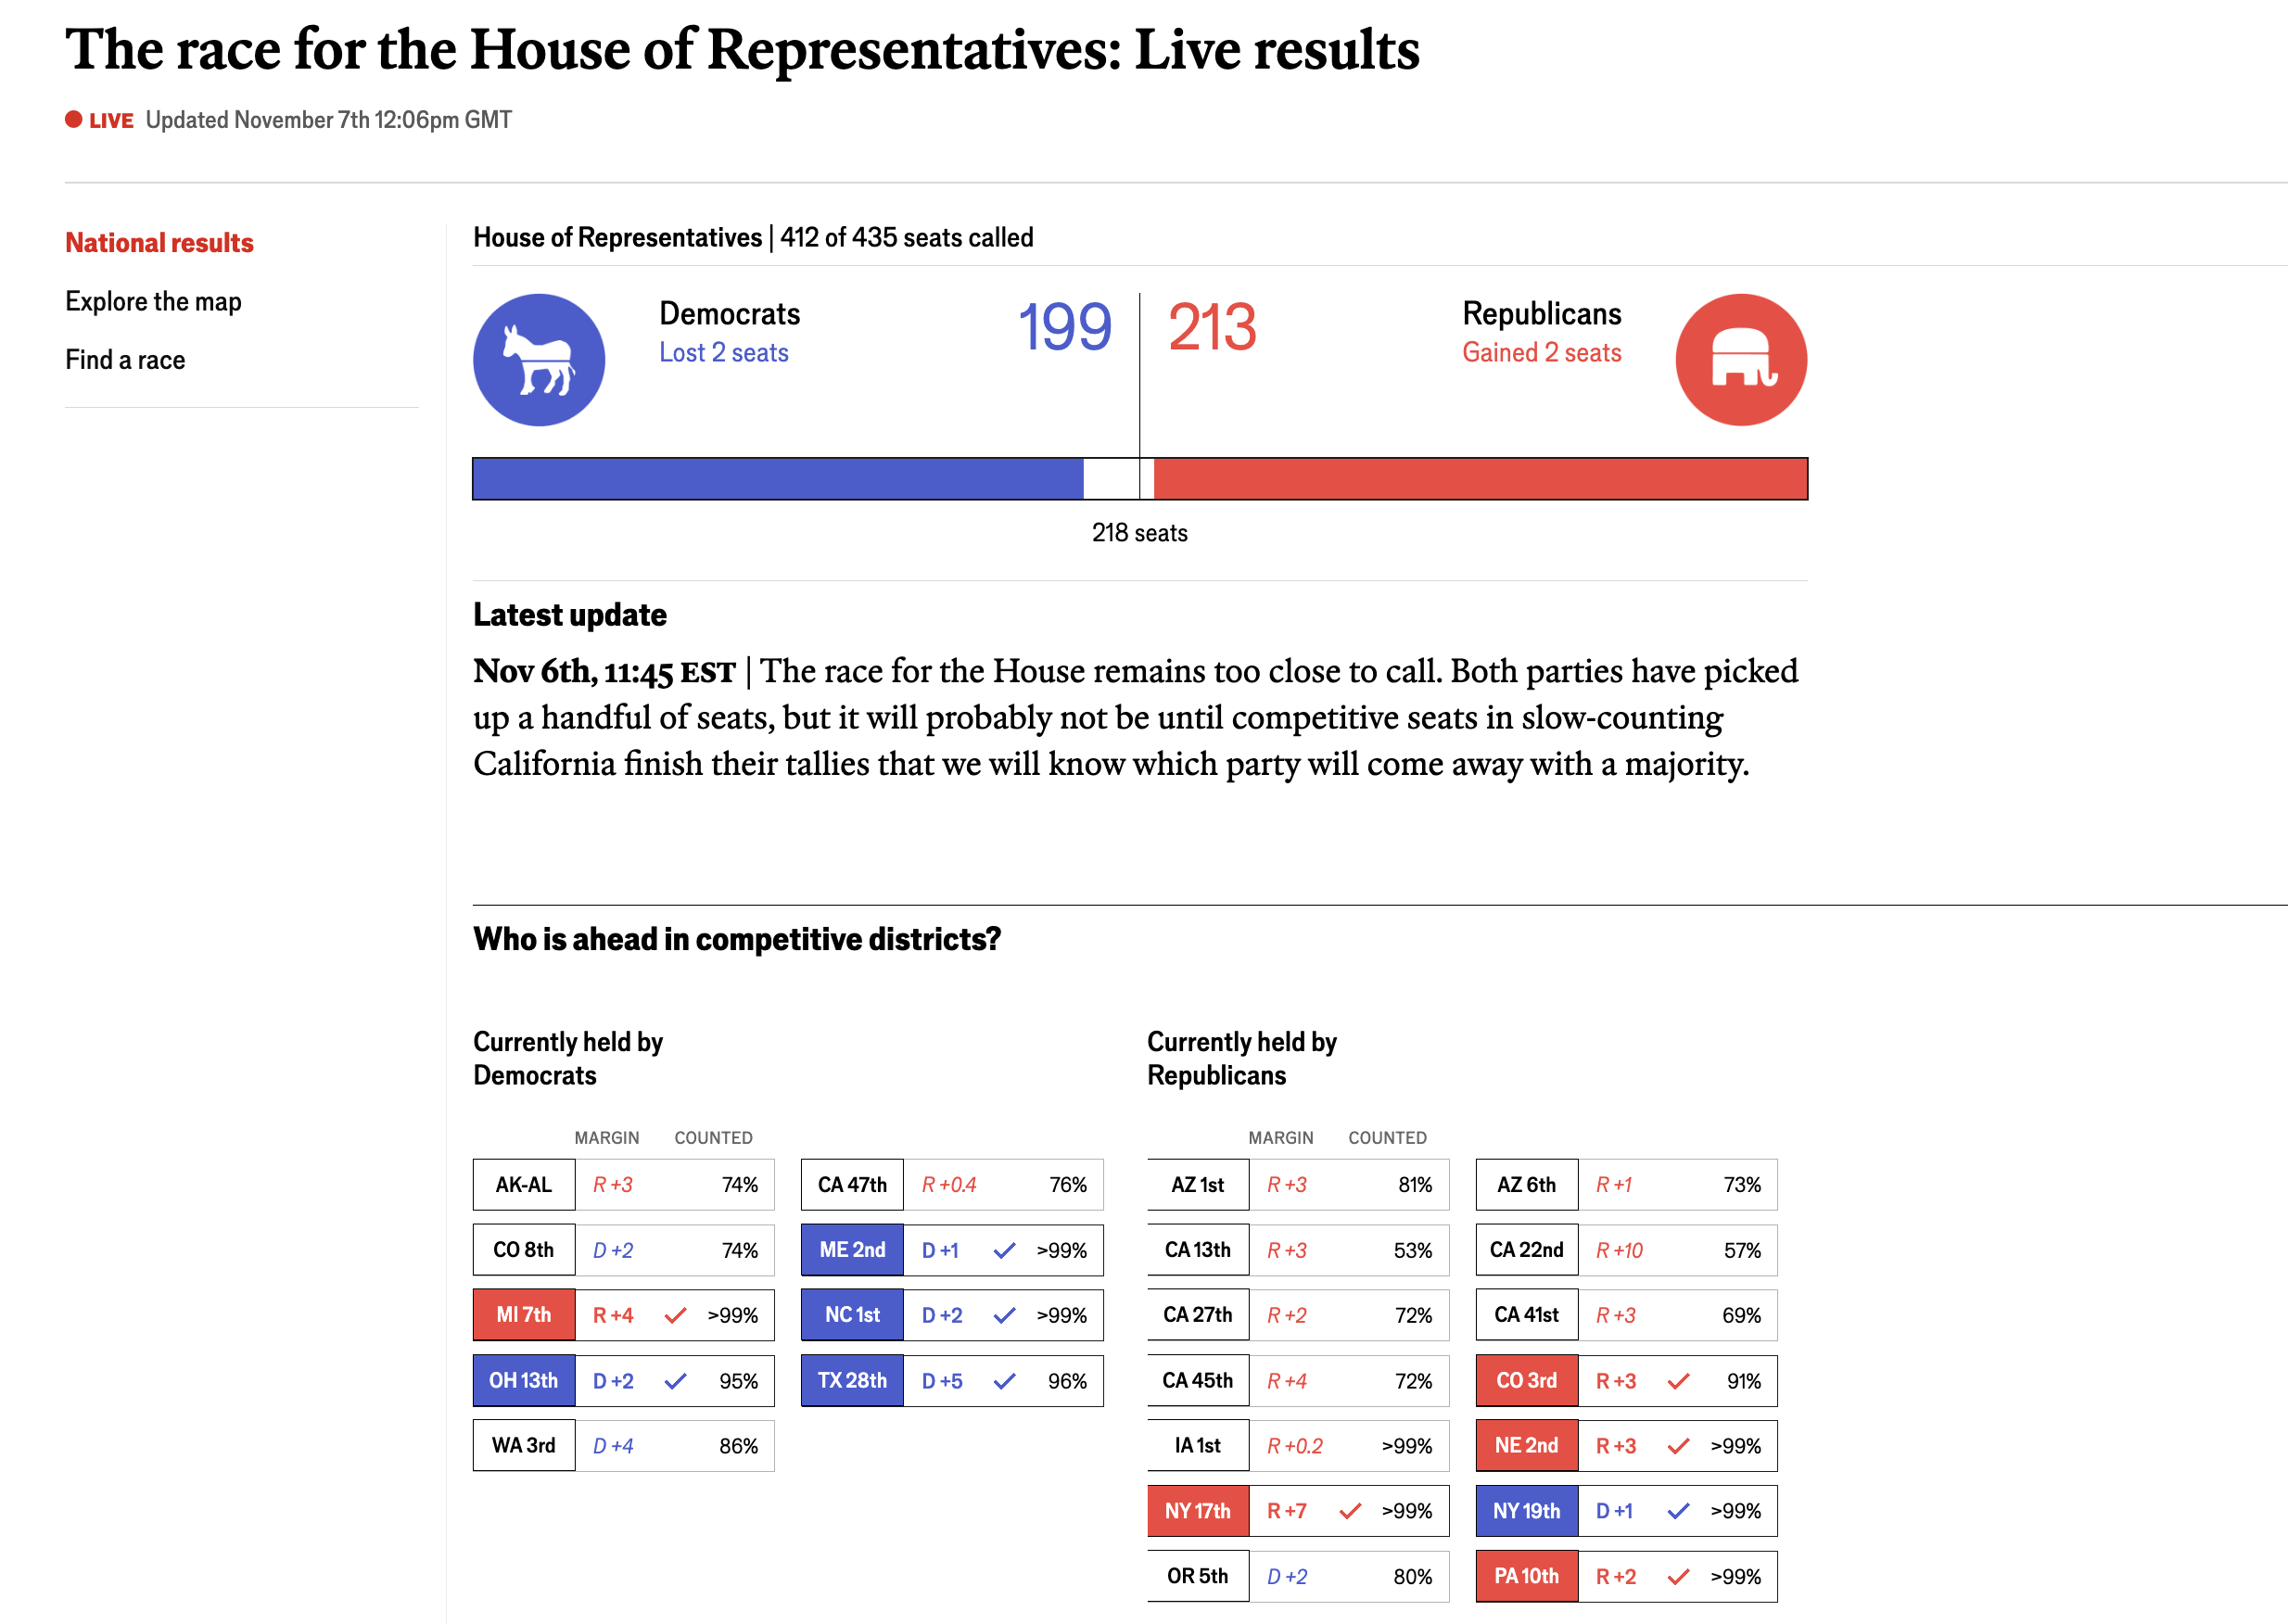
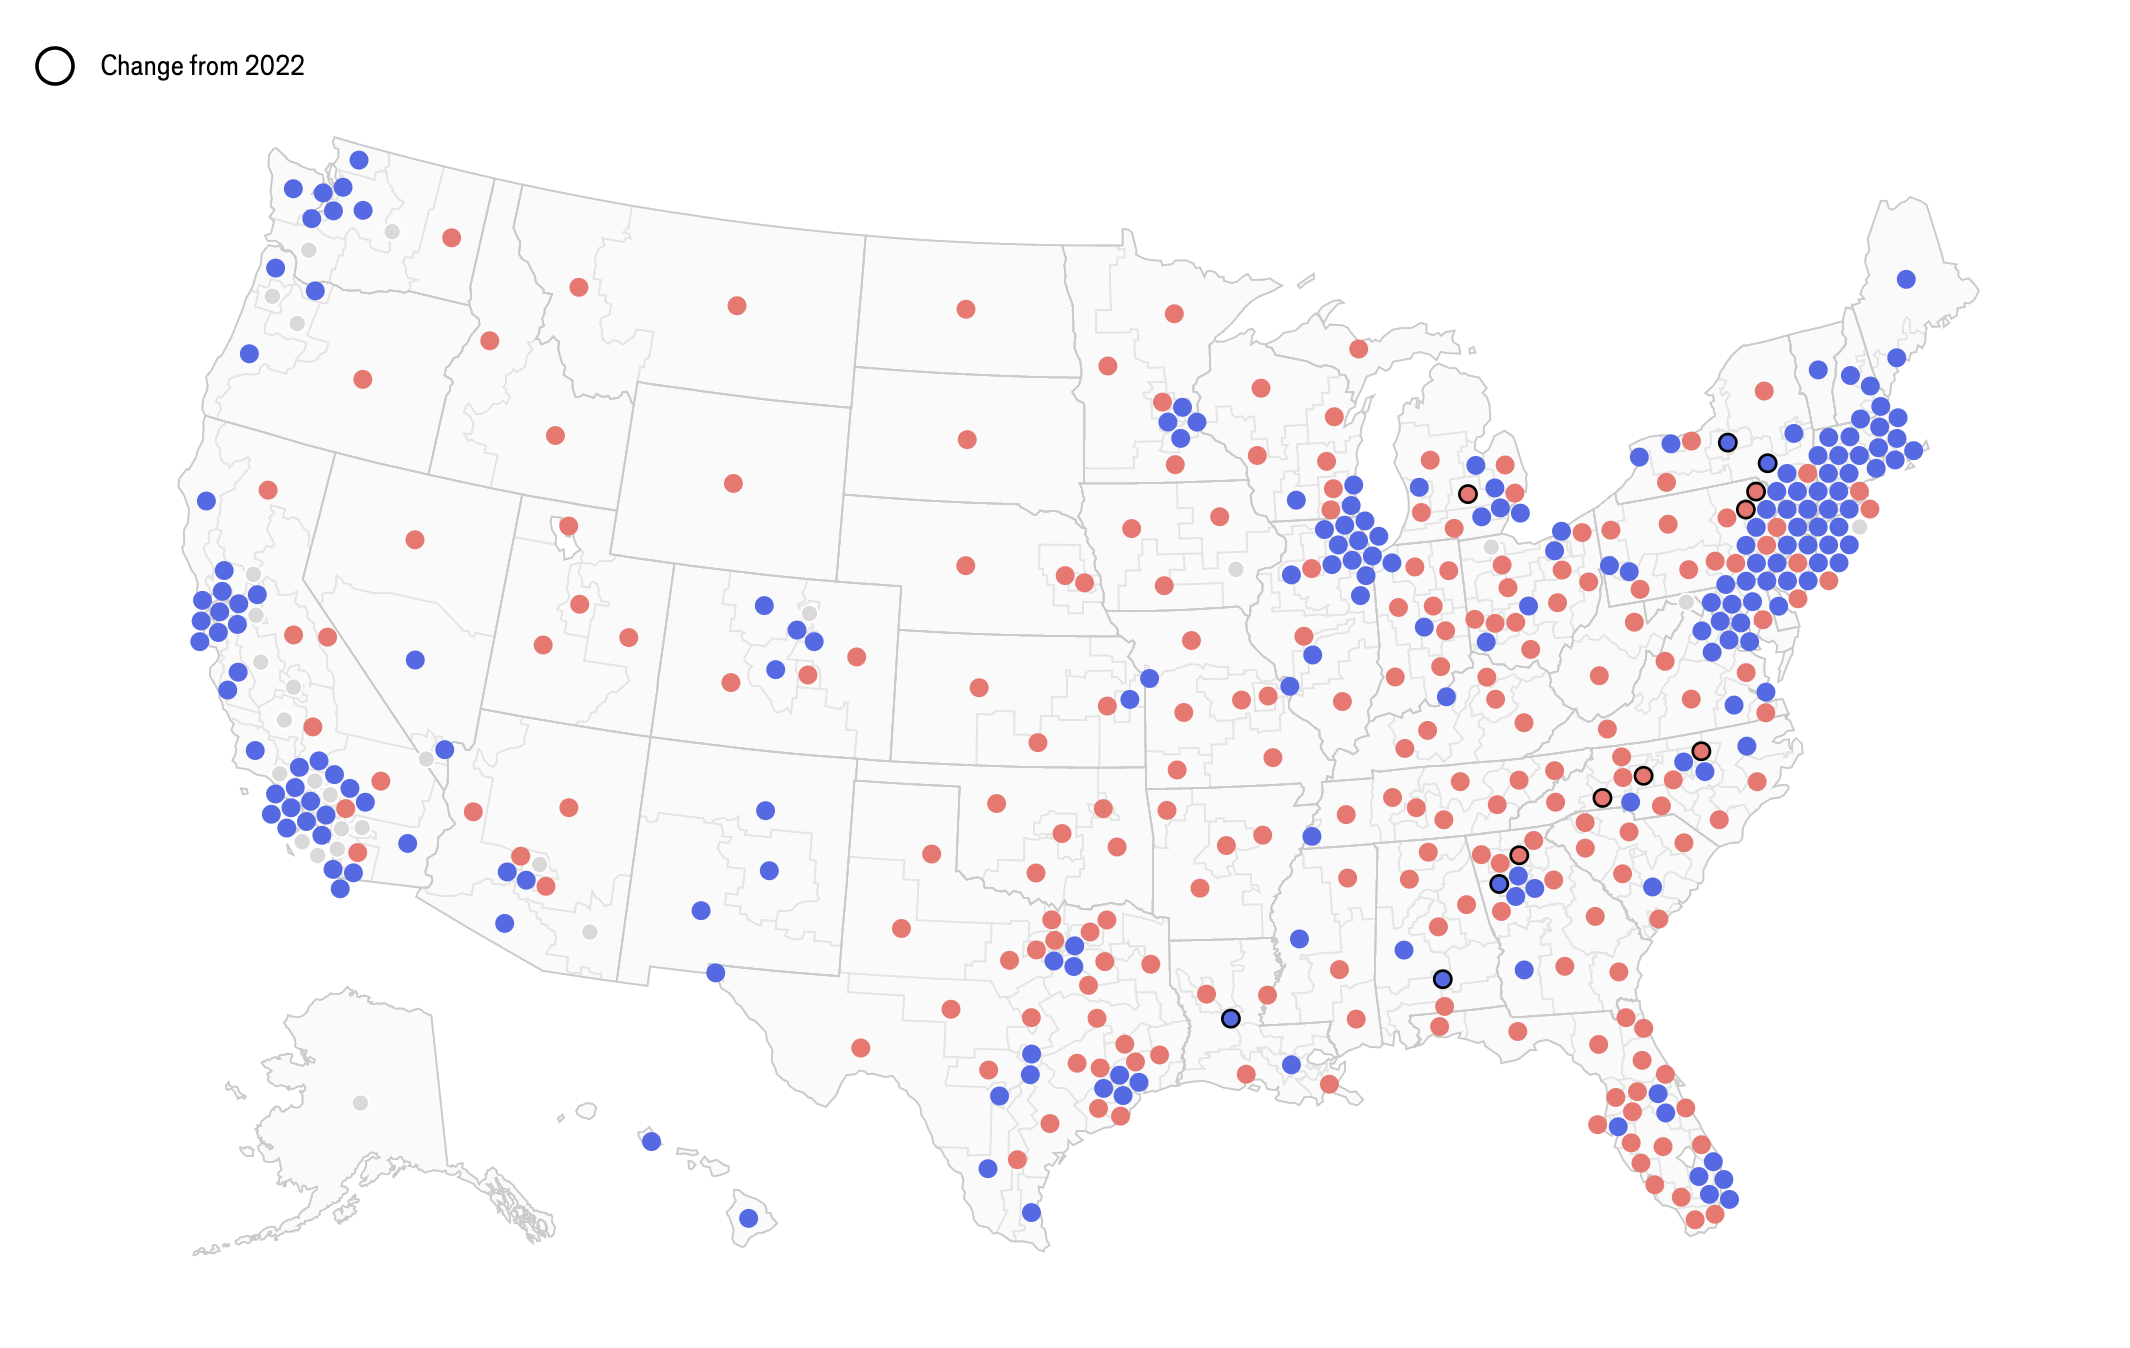
After the release of our prediction-model we started working on the results pages to visualise the results live as they came in. We utilised the same map components for the forecast for the results so it was fairly easy to get set up. These I built along with the topline elements for the Presidential, Senate and House results which you can see in the images below. However there were lots of other visual components too that you can see on the site.
Most of the complications were on the back-end, handling formatting and edge cases from the data pipeline. It was important to handle edge cases well - races were there was only one candidate running, or multiple candidates from the same party as well as independents that were likely to win (in the case of Vermont or Maine).
Vigorous testing using fake data was essential to see how the data may visualise on the night - before the election we would run tests frequently and capture any issues. Other than some small tweaks that had to be made on the night of the election (which was always going to happen) it was success and signified the end of a long but rewarding project of visualising US politics.
